Exposing Traefik dashboard to a subdomain
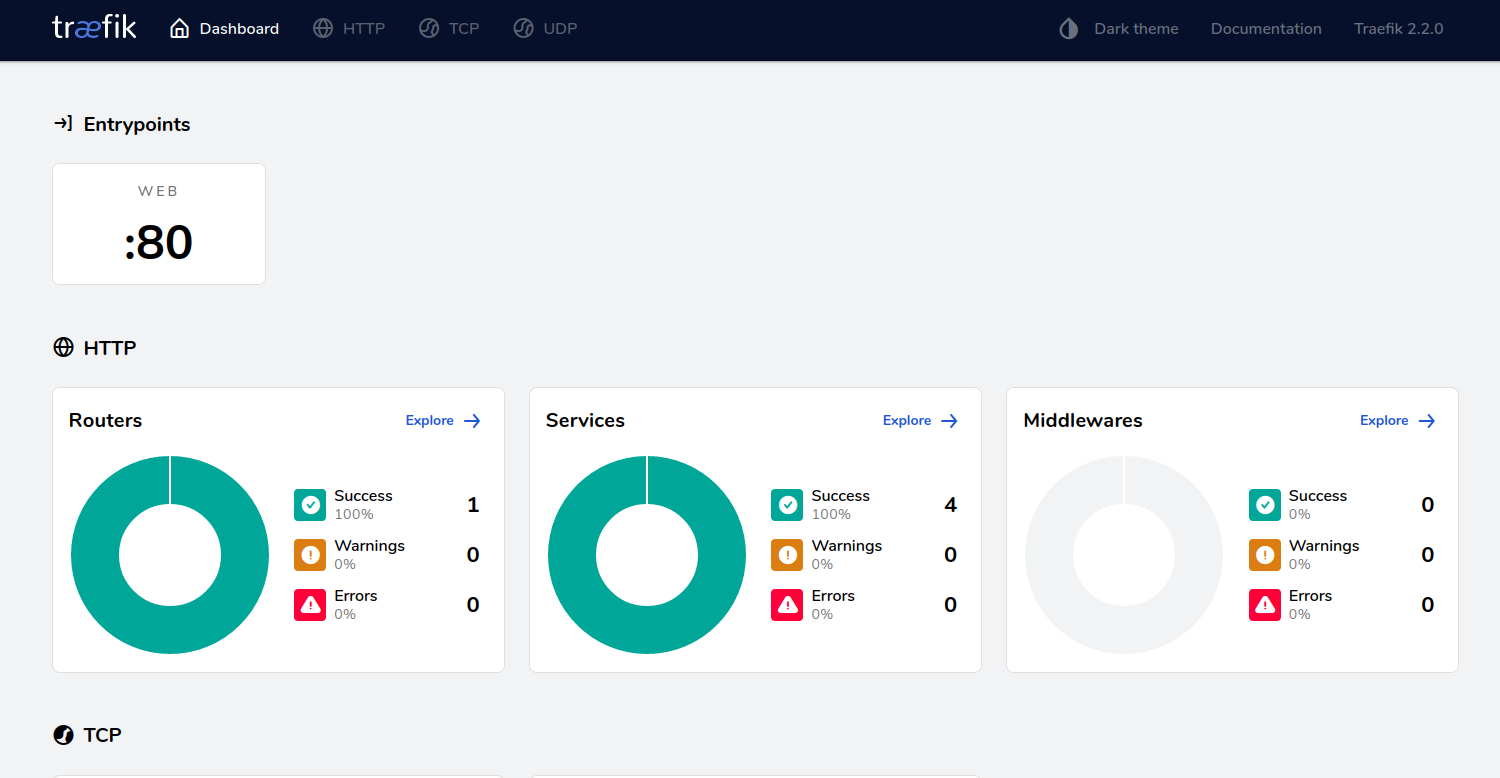
T he Traefik dashboard is the central place where everything you configured is represented in a clear manner. In case you are running into problems and you are in need to do some troubleshooting, the dashboard should be your place to go.
In the dashboard here you can see all your entrypoints (ports Traefik listens to), routers (connects requests to services), services (define how to reach your actual services) and middlewares (tweak your services eg. adding authentication)
Traefik configuration
The configuration of the dashboard is on the Traefik container itself.
No further containers are needed.
Apart from the usual configuration the dashboard in the commands section has to be allowed.
The other configuration is as usual in the labels section of the Traefik container.
There Traefik has to be enabled to allow listening to entrypoints.
The entrypoint is the default HTTP port and we define the host.
To access the dashboard locally we set it to traefik.localhost.
Our service can be reached calling that URL.
To link the dashboard to the previously defined host name, the service has to be set to api@internal.
This is a Traefik specific service which represents the API and the dashboard.
  traefik:

    image: traefik:3.5

    command:

      - "--providers.docker=true"

      - "--entrypoints.web.address=:80"

      - "--api.dashboard=true"

    ports:

       - "80:80"

    volumes:

      - /var/run/docker.sock:/var/run/docker.sock

    labels:

      - "traefik.enable=true"

      - "traefik.http.routers.api.entrypoints=web"

      - "traefik.http.routers.api.rule=Host(`traefik.localhost`)"

      - "traefik.http.routers.api.service=api@internal"
If you now start the service with docker-compose up and navigate to traefik.localhost you are able to access the dashboard.
Further readings
Because you are showing a lot of sensible information about your network and your running services you should always add authentication to secure your dashboard whenever it is publicly available.
As always full source code is available on GitHub.
